Energy and Information Systems: Observation 33. A scale model of every system. 2010

This model describes how things move in terms of the six perspectives of cognition. When I was fifteen, I decided to explain it as part of a future ecological project. If you are reading this, Project Honeylight has started.
Observation:
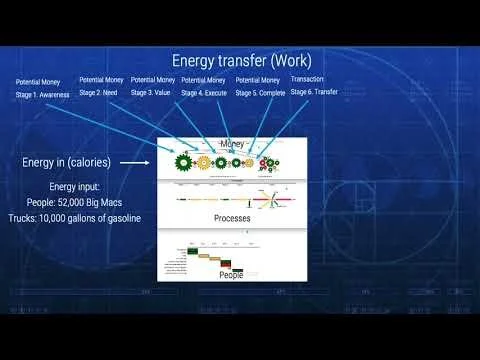
Energy and information systems can be understood as a holistic system at snapshots in time, just like thermodynamics is a way to understand energy transfer mathematically.
The Lesson:
Simplifying explanations and understanding how others process information is essential for effective communication and relating to people with different perspectives.
How this is helpful:
Communication: Enhancing communication by simplifying explanations and bridging gaps in understanding.
Self-awareness: Increasing self-awareness and the ability to relate to others by recognizing and respecting their perspectives.
Holistic Understanding: Fostering a holistic understanding of complex systems like energy and information transfer.
Questions for Reflection:
What assumptions do I make when explaining complex concepts to others, and how can I simplify my explanations to improve communication?
How can I enhance my self-awareness and better relate to people with different perspectives?
What other areas in life can benefit from a more holistic understanding, similar to energy and information systems?
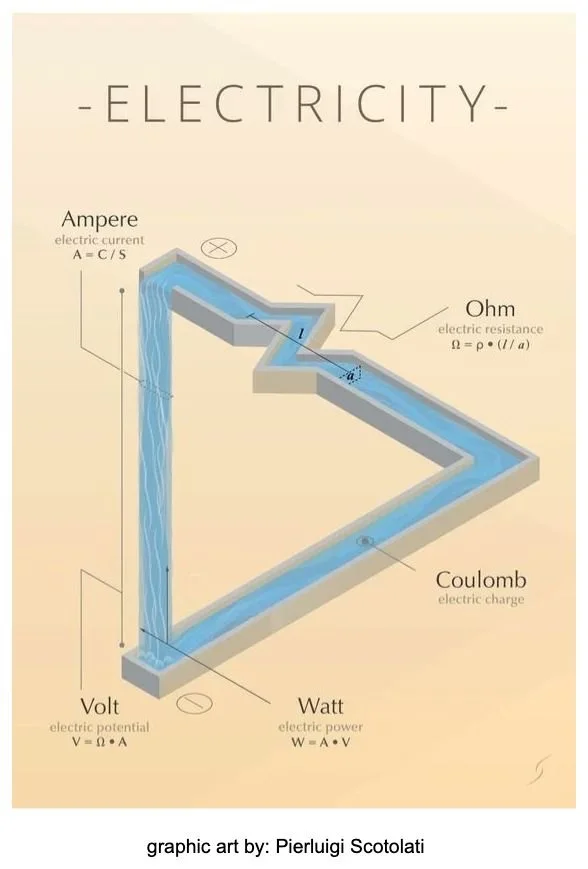
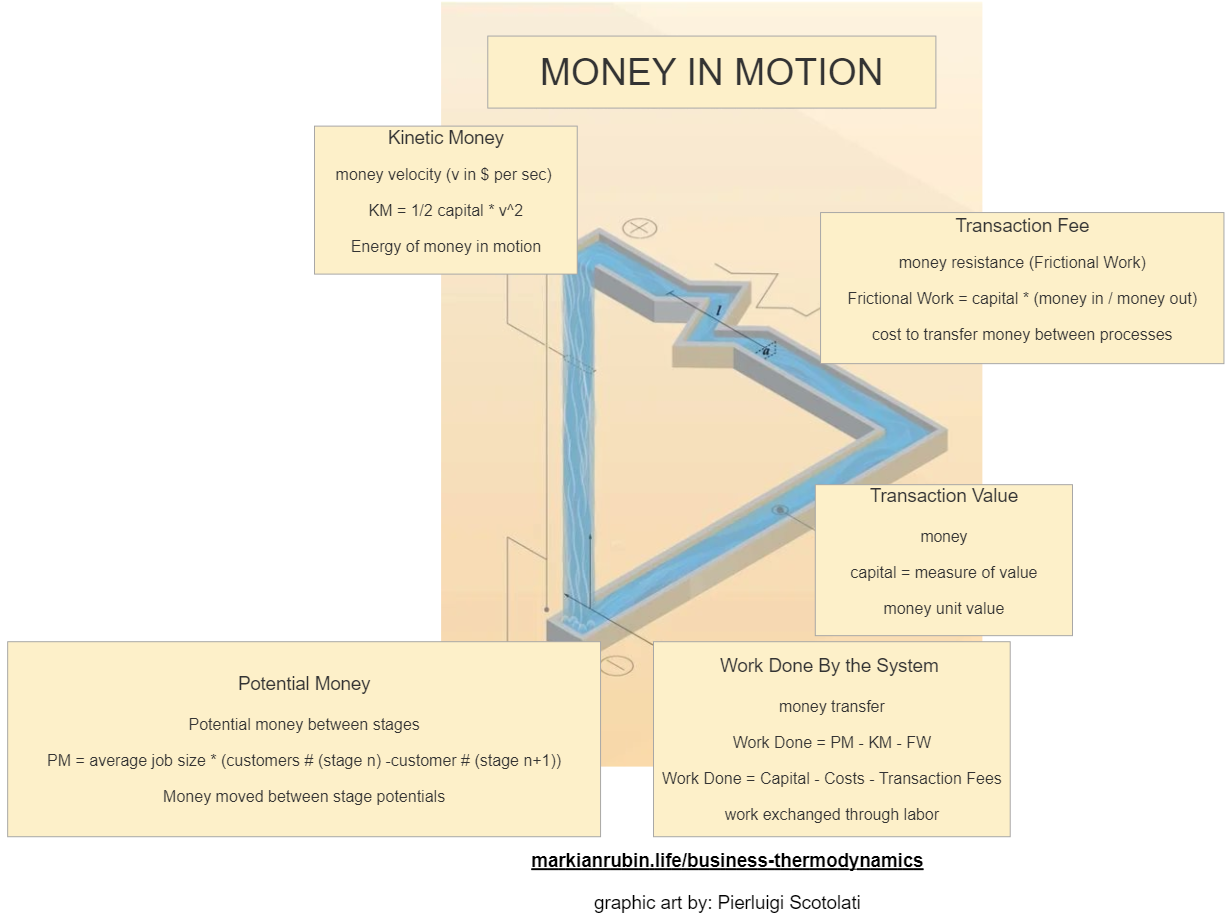
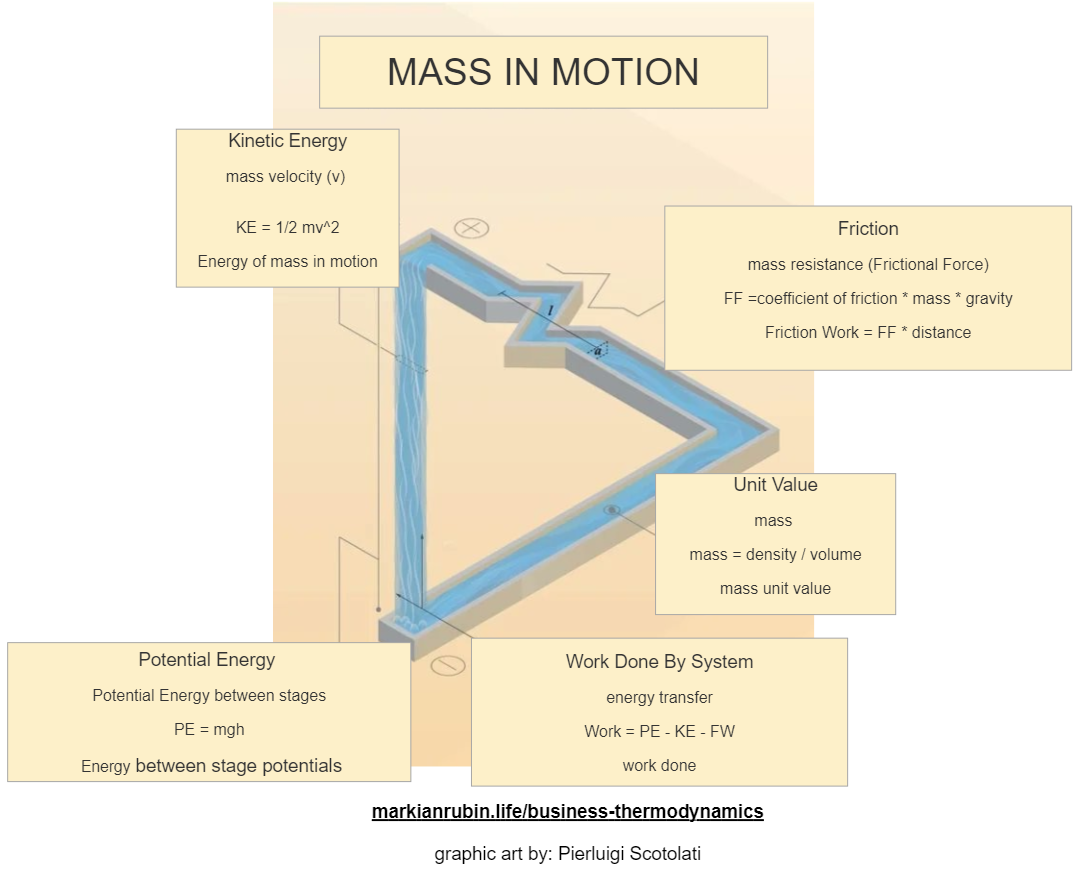
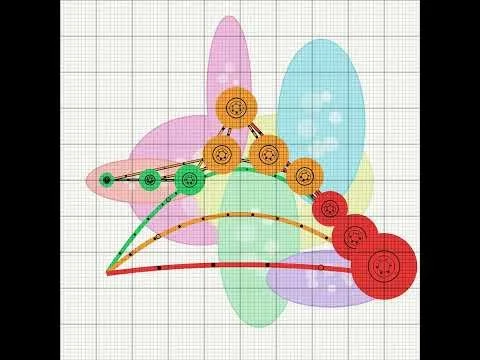
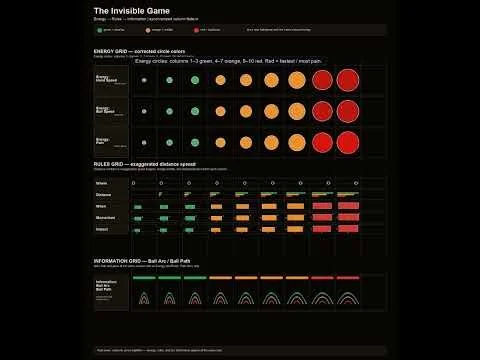
This model links six visual perspectives—who and what, how much, where, when, how, and why—across time-sequenced views of Energy, Information, and Rules. Each element is color-coded by the variance among its theoretical, potential, and realized value. The optimization loop measures the results, validates and evaluates the variance, then updates the rules to improve how processes move energy through the system. The model can represent mass in motion, honey in motion, money in motion, or any other object moving through a system and the categories used to describe it.
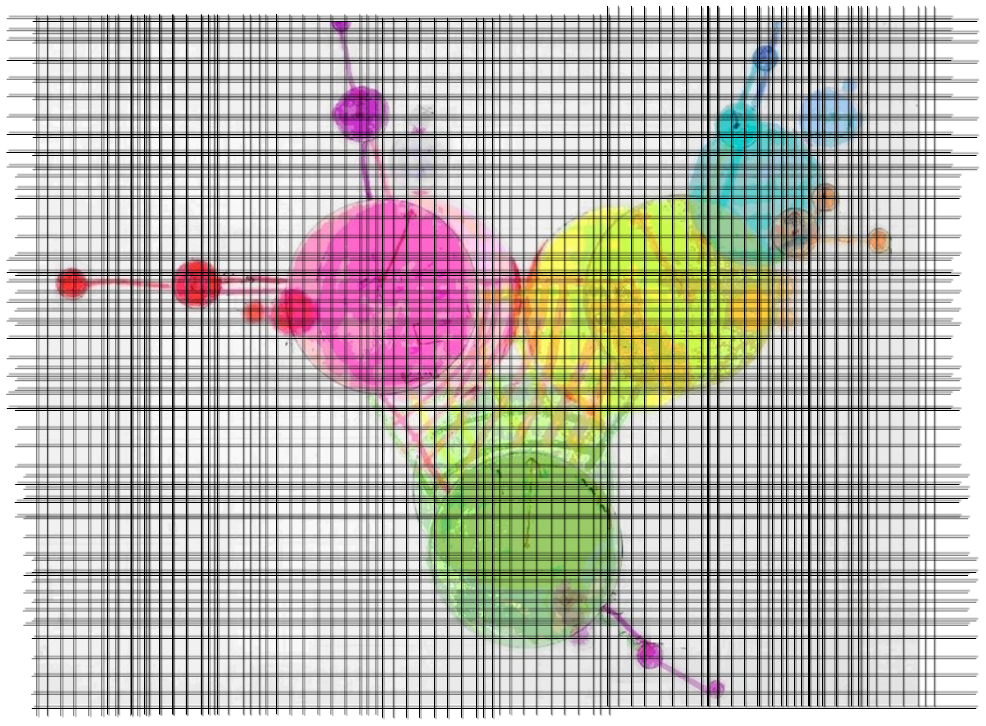
I fed all of my models into obsidian and it generated this ontology. HiveMind uses this ontology to generate business optimizations.